Landscapes
The dynamical change of local CI scores demonstrates the landscape of the network entropy in a global view. The increase of CI score provides an early-warning signal for the disease state, i.e., the stage that clinical symptom arises.
Acute lung injury (GSE2565 & Mus musculus) or
Lung adenocarcinoma (TCGA_LUAD & Homo musculus) or
Thyroid carcinoma (TCGA_COAD & Homo sapiens) or
Lung Squamous Cell Carcinoma (TCGA_LUSC & Homo musculus) orThe outbreak of influenza in Tokyo (flu_tokyo) or
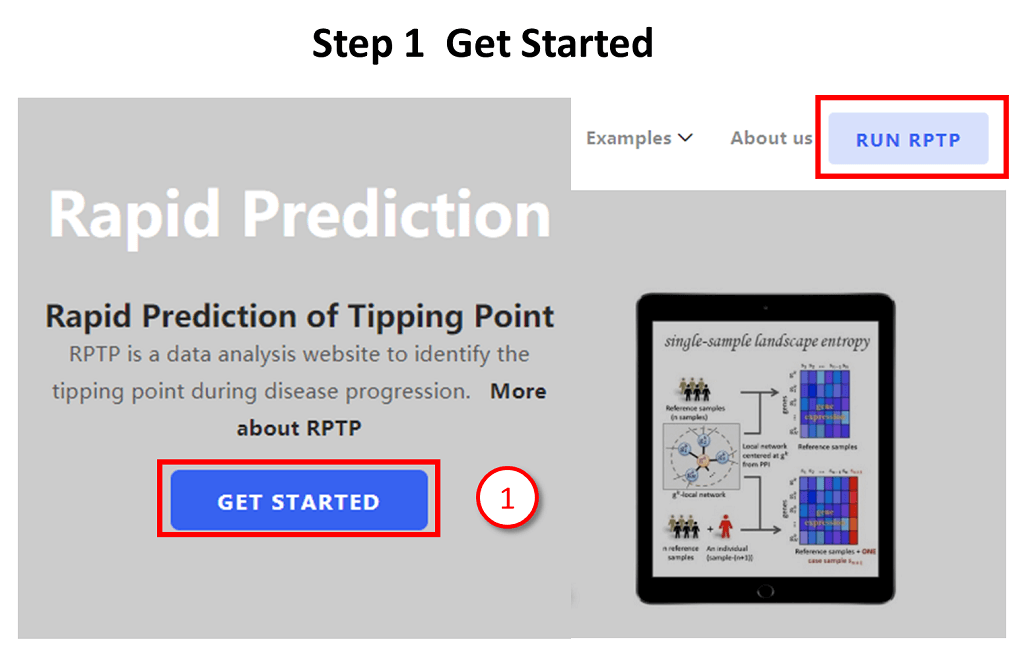
Step 1 Get Started
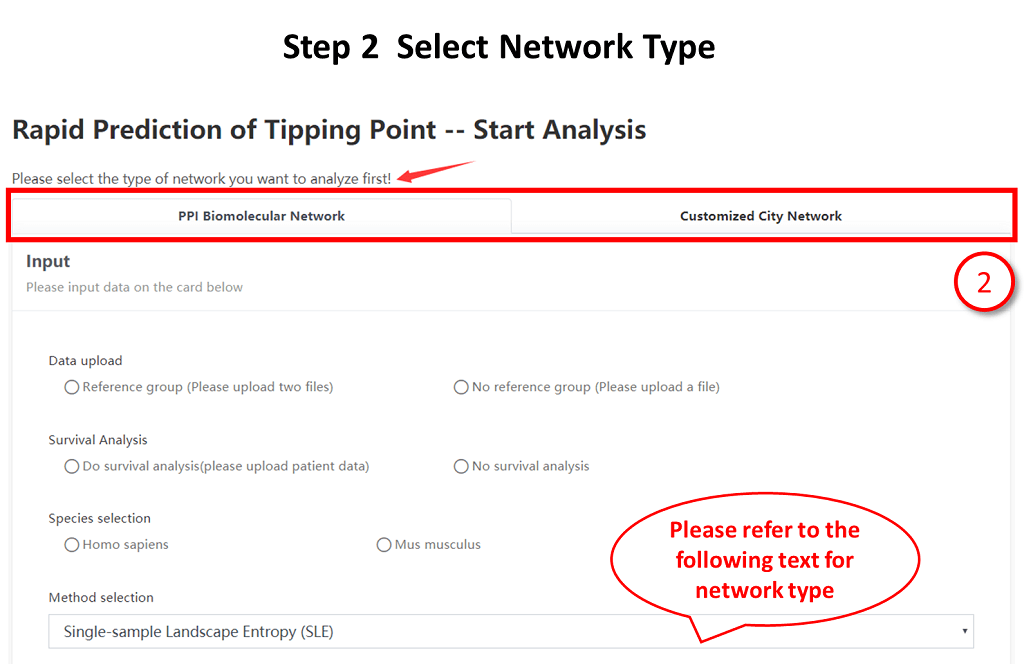
Step 2 Select Network Type
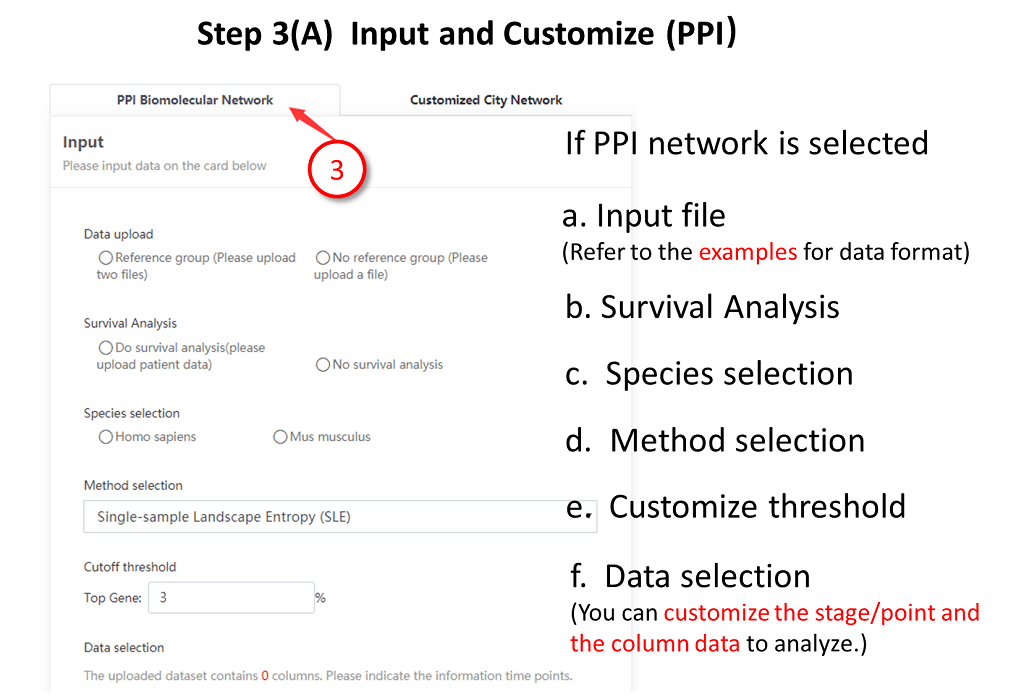
Step 3(A) Input and Customize(PPI)
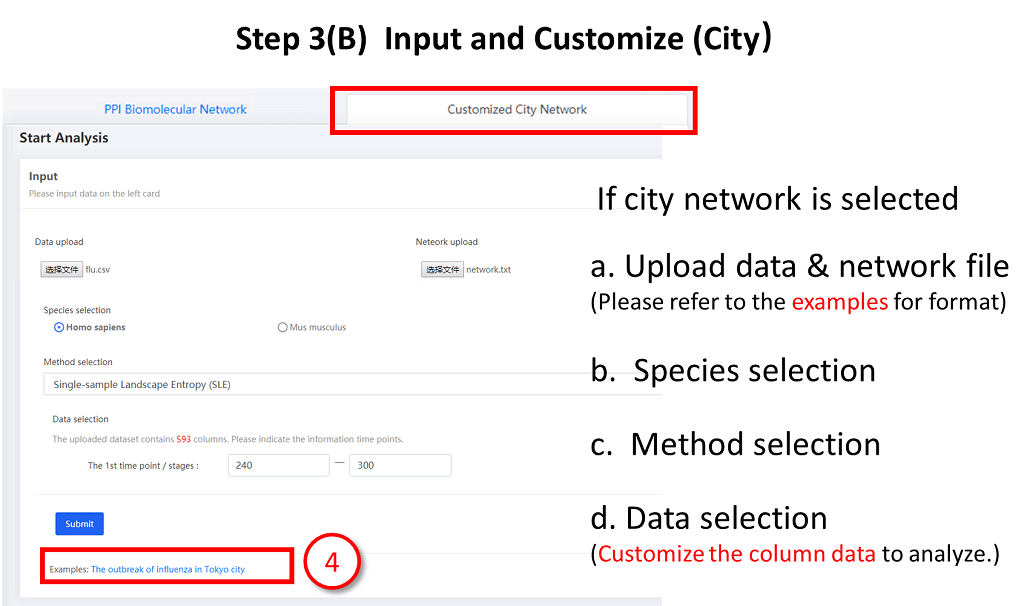
Step 3(B) Input and Customize(DNB city network)
Step 4 Submit and Output
Click Get started or Run TPD to enter the Analysis page;
Select the appropriate network type to analyze, including PPI biological network and city network;
Then download the example file (.zip). The example compressed file contains Data files and Readme files. For data description and detailed setting description, please refer to the Readme file;
Specify the data format, and refer to Readme file for data input and setting;
Please click for data format description and sample demonstration;
Click and wait for the result.
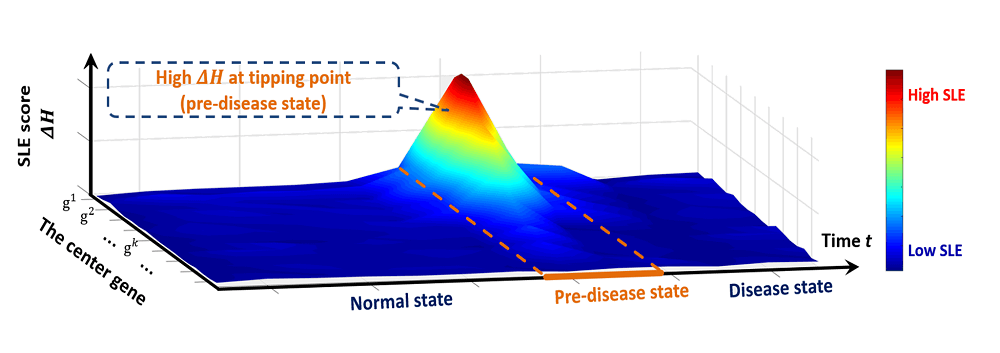
The dynamical change of local CI scores demonstrates the landscape of the network entropy in a global view. The increase of CI score provides an early-warning signal for the disease state, i.e., the stage that clinical symptom arises.
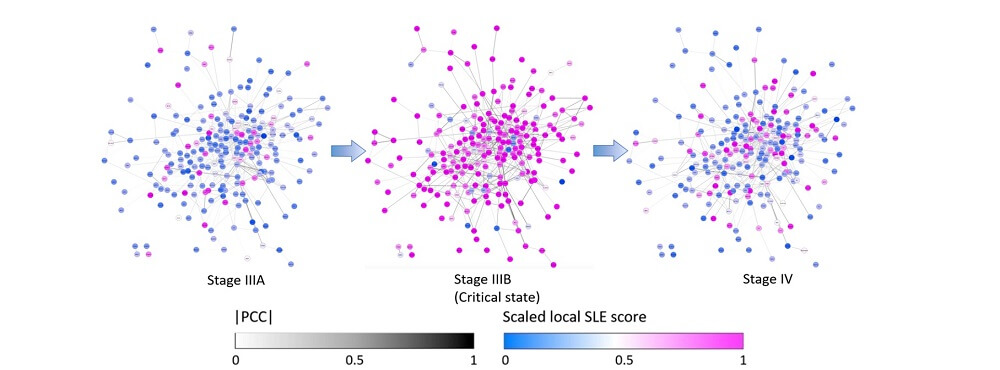
The network structure is derived by mapping genes to the STRING PPI network. The evolution of the top CI gene group/module, i.e., the top 200 genes with the largest local CI scores, illustrates that a significant change in the network structure occurs at stage IIIB.
The x-axis represents the different stages of the disease, and the y-axis represents the average CI score of different samples in the same stage.
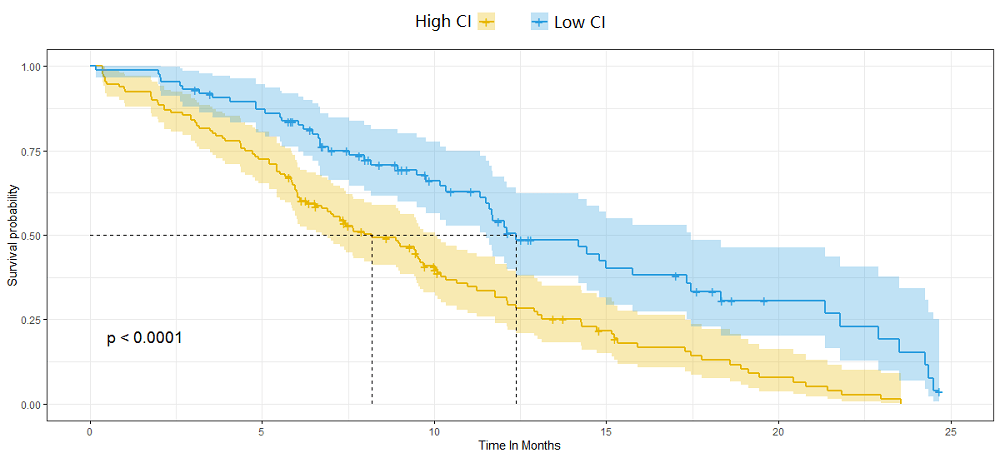
Such survival analysis was based on the local CI score, which is the CI value for a local network centered on each above gene, not gene expression value.
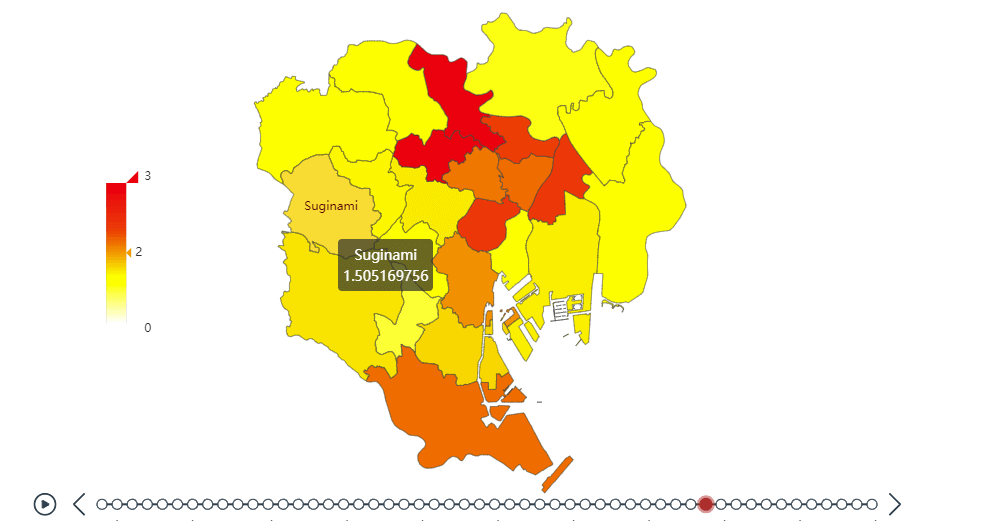
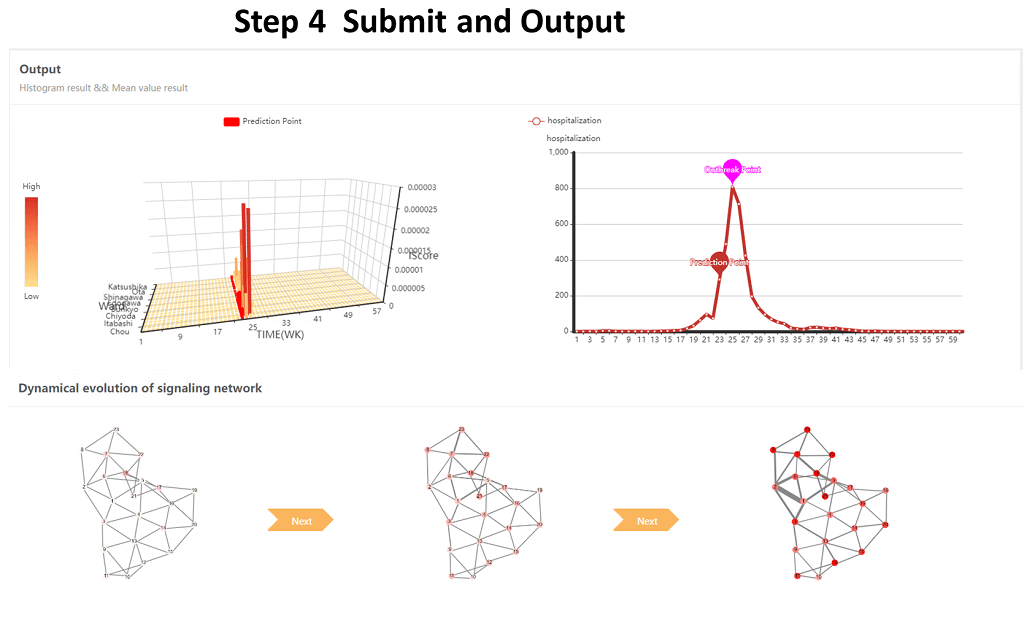
Real-time monitoring and analysis of infectious diseases epidemic.
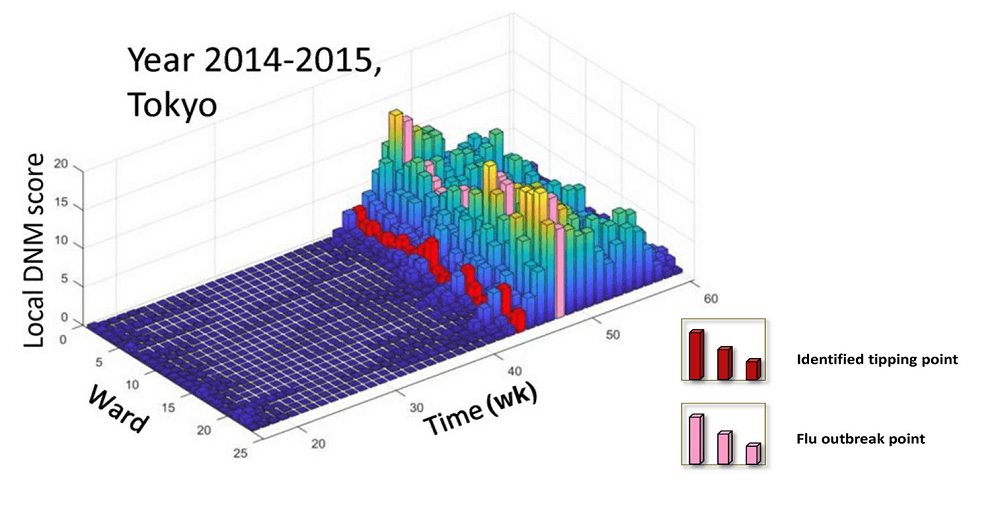
The local DNM scores or landscapes for 23 wards in Tokyo city.
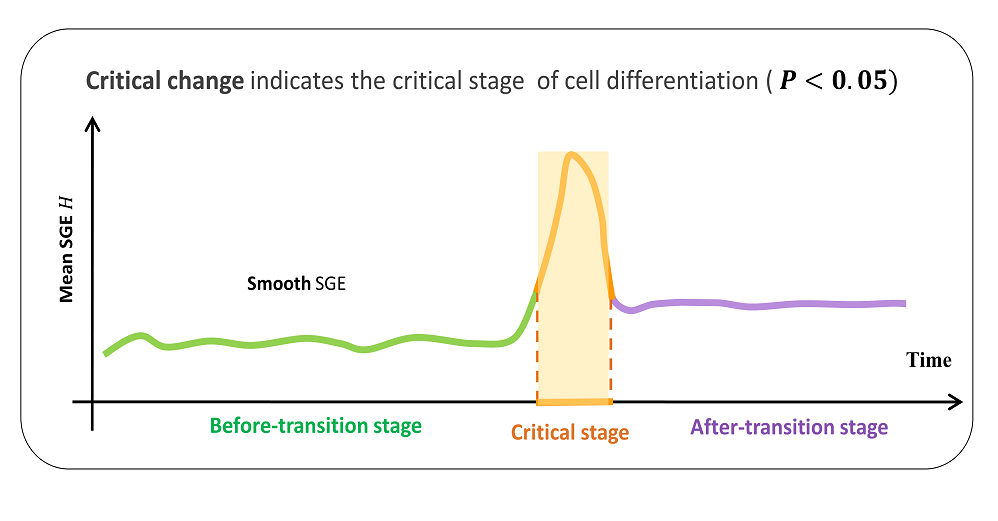
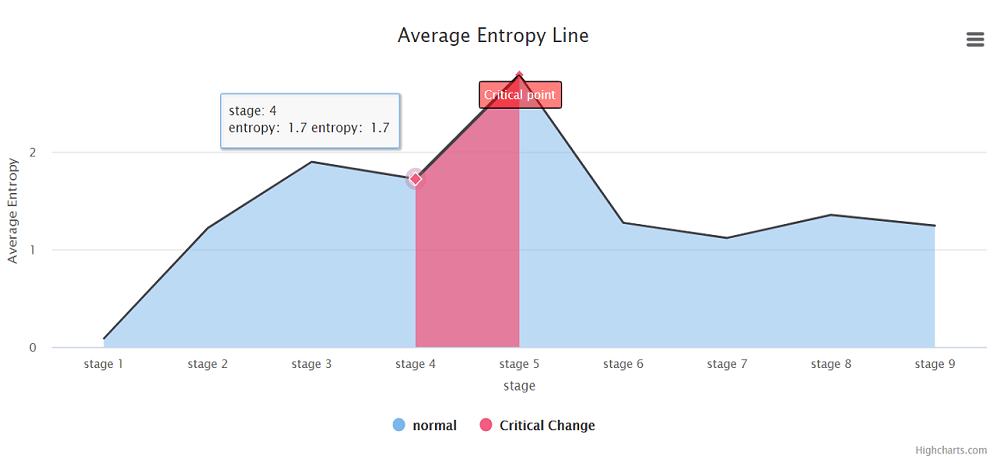
The signal of a critical transition is illustrated by the significant increase of SGE, i.e., the SGE keeps smooth when the system is in a before-transition stage, while it increases abruptly when the system approaches the critical stage..
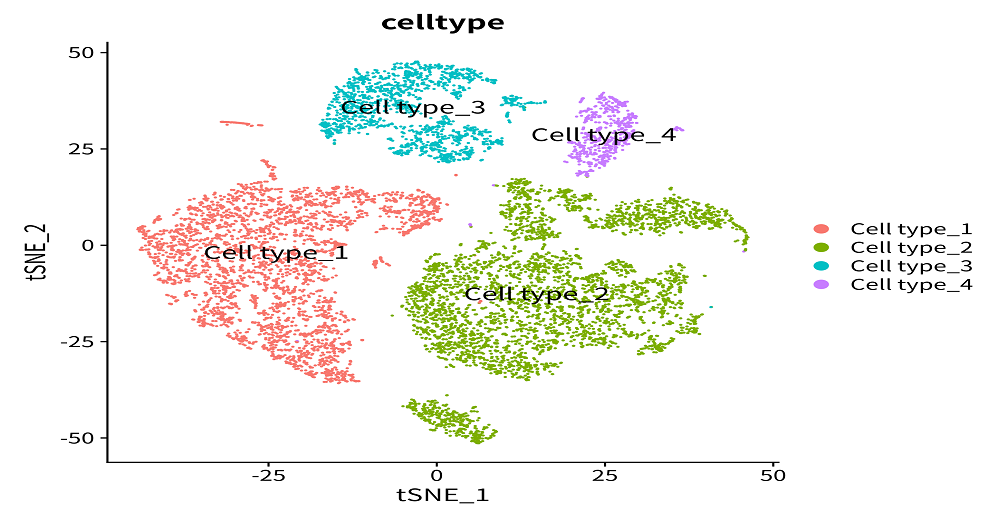
SGE scores provide a way to perform temporal clustering analysis on cells during a biological process and thus explore the dynamic information of cell populations. The t-distributed stochastic neighbor embedding (t-SNE) is applied to carried out dimension-reduction analysis and visualization.