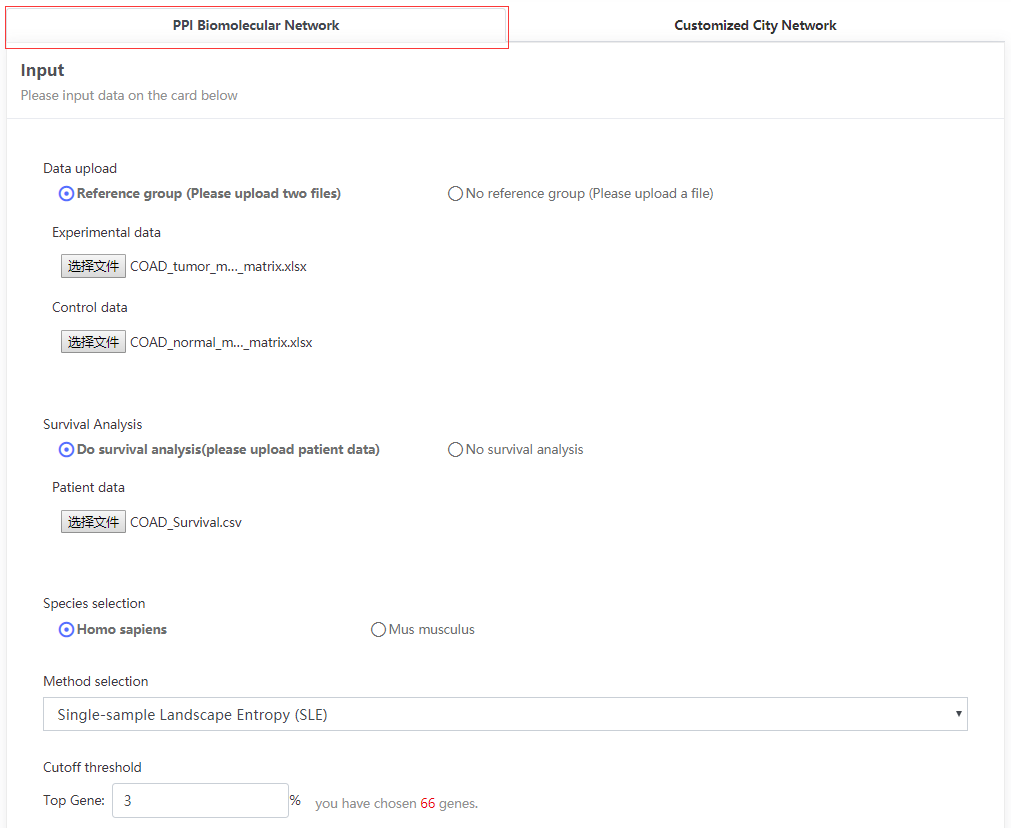
Ⅰ. What is Thyroid carcinoma (TCGA_COAD & Homo sapiens)

or

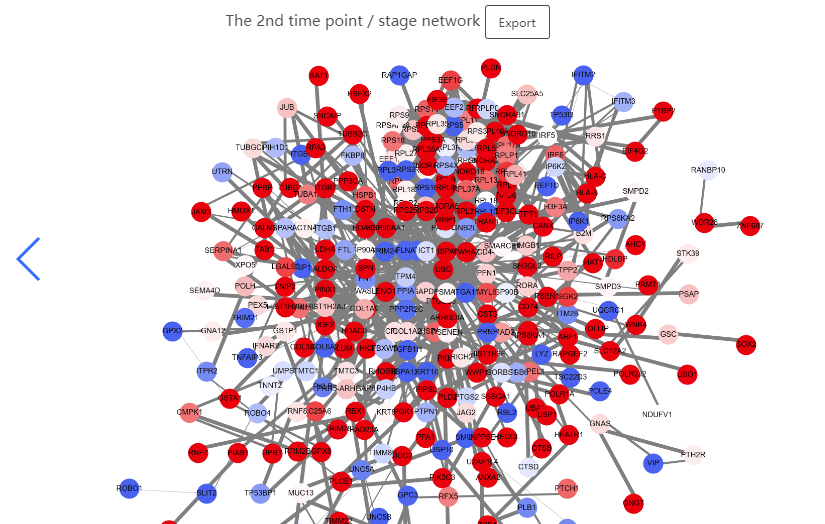
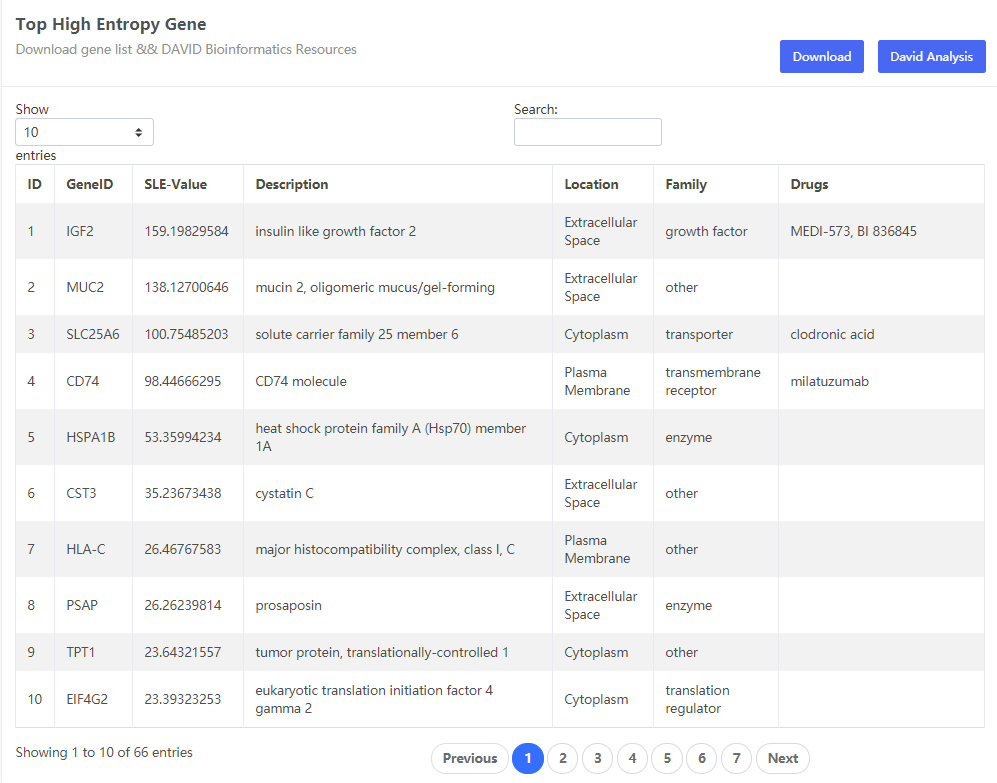
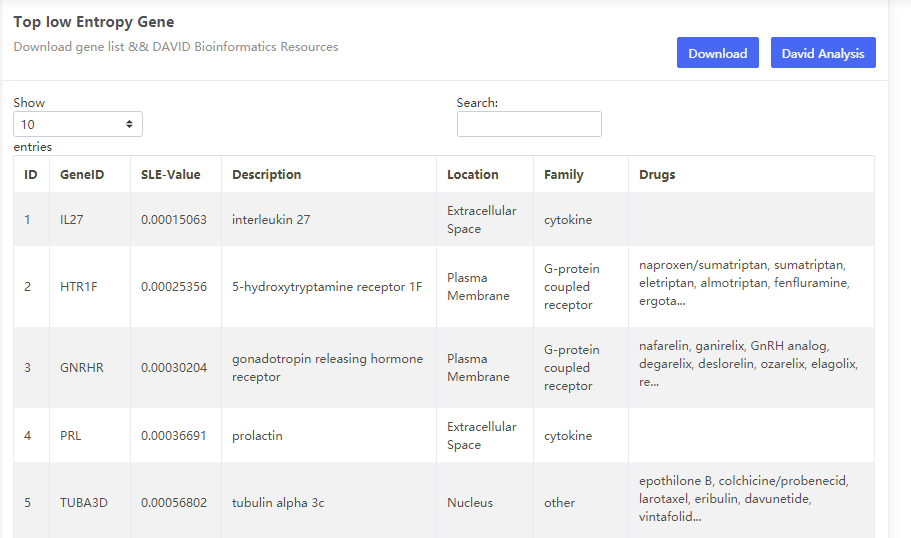
This data set is applicable to PPI Biomolecular Network.

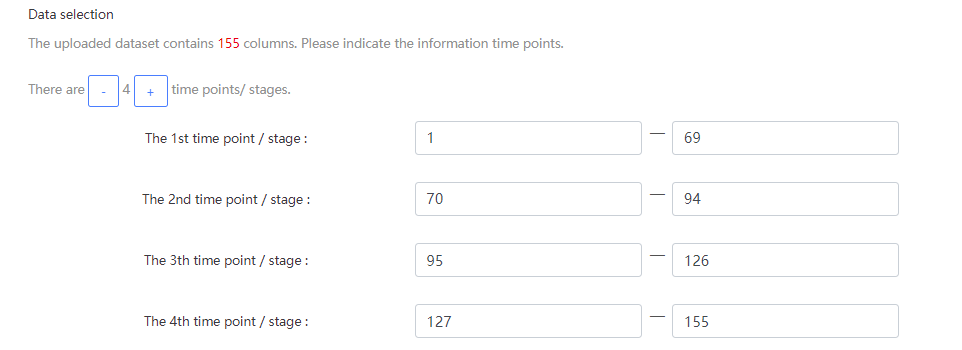
The cancers datasets from TCGA contained RNA-Seq data and included both tumor and tumor-adjacent samples. The tumor samples were divided into different stages according to corresponding clinical information of TCGA. (https://portal.gdc.cancer.gov/projects/TCGA-COAD)

Ⅱ. Input Data format

TPD can read two types of files: .xlsl/.xls or .csv.

Example Data format: The tumor and tumor-adjacent samples can be respectively processed as a microarray. They have the same row size, but column size is different. The row represents gene expression level of samples. The column represents different cancer stages.

Please refer to the above format for user-defined data.

Ⅲ. Parameter Setting

Bold font indicates the parameter settings of this example.

Data upload: If the reference group is selected, please upload two files, including case data and control data. If the no reference group is selected, please upload a case file.The analysis system takes the first time point/stage as control data.

Survival Analysis: Choice on demand.This example provides survival analysis data.

Species selection: Different Species selections correspond to different PPI networks.This example belongs to Homo sapiens.

Method selection: Single-sample Landscape Entropy(SLE).

Cutoff threshold: This threshold determines the number of genes in network map, high entropy gene table and low entropy gene table.5% by default.

Data selection: Group data by column. There are totally 155 columns in this example. Different columns indicate that the number of samples at each time / stage point is different.

Ⅳ. Output

Line chart with Tipping Point:The x-axis represents different stages, and the y-axis represents the average SLE score of the current stage.

Landscape based on SLE Score:The dynamical change of local SLE scores demonstrates the landscape of the network entropy in a global view. The x-axis represents different stages,and the y-axis represents different genes, and the z-axis represents the average SLE score of the current stage.

Dynamic network:The color of each node corresponds to its entropy (blue for low entropy, red for high entropy); the thickness of each edge corresponds to its correlation.

Top High/low Entropy Gene:High entropy and low entropy genes are tabulated and downloadable.

Survival Analysis:Since survival analysis is needed and necessary data files are uploaded, this example can give survival analysis curve.