Landscapes
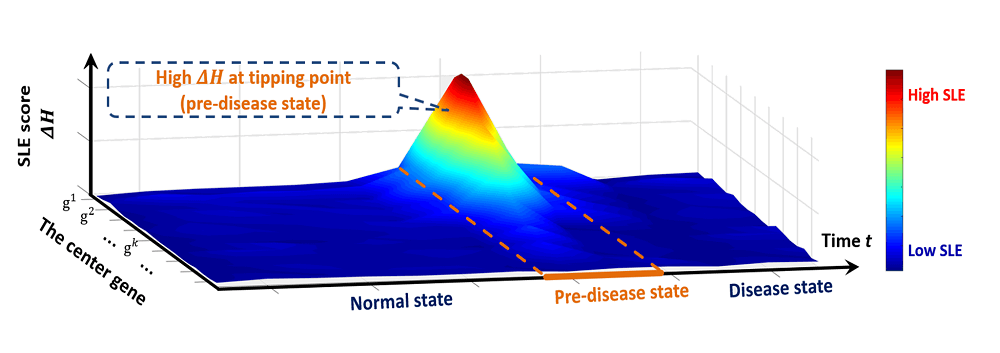
The dynamical change of local SLE scores demonstrates the landscape of the network entropy in a global view. The increase of SLE score provides an early-warning signal for the disease state, i.e., the stage that clinical symptom arises.
The x-axis represents different stages,and the y-axis represents different genes, and the z-axis represents the average SLE score of the current stage.