Ⅰ. What is Acute lung injury (GSE2565 & Mus musculus)

or

This data set is applicable to PPI Biomolecular Network.

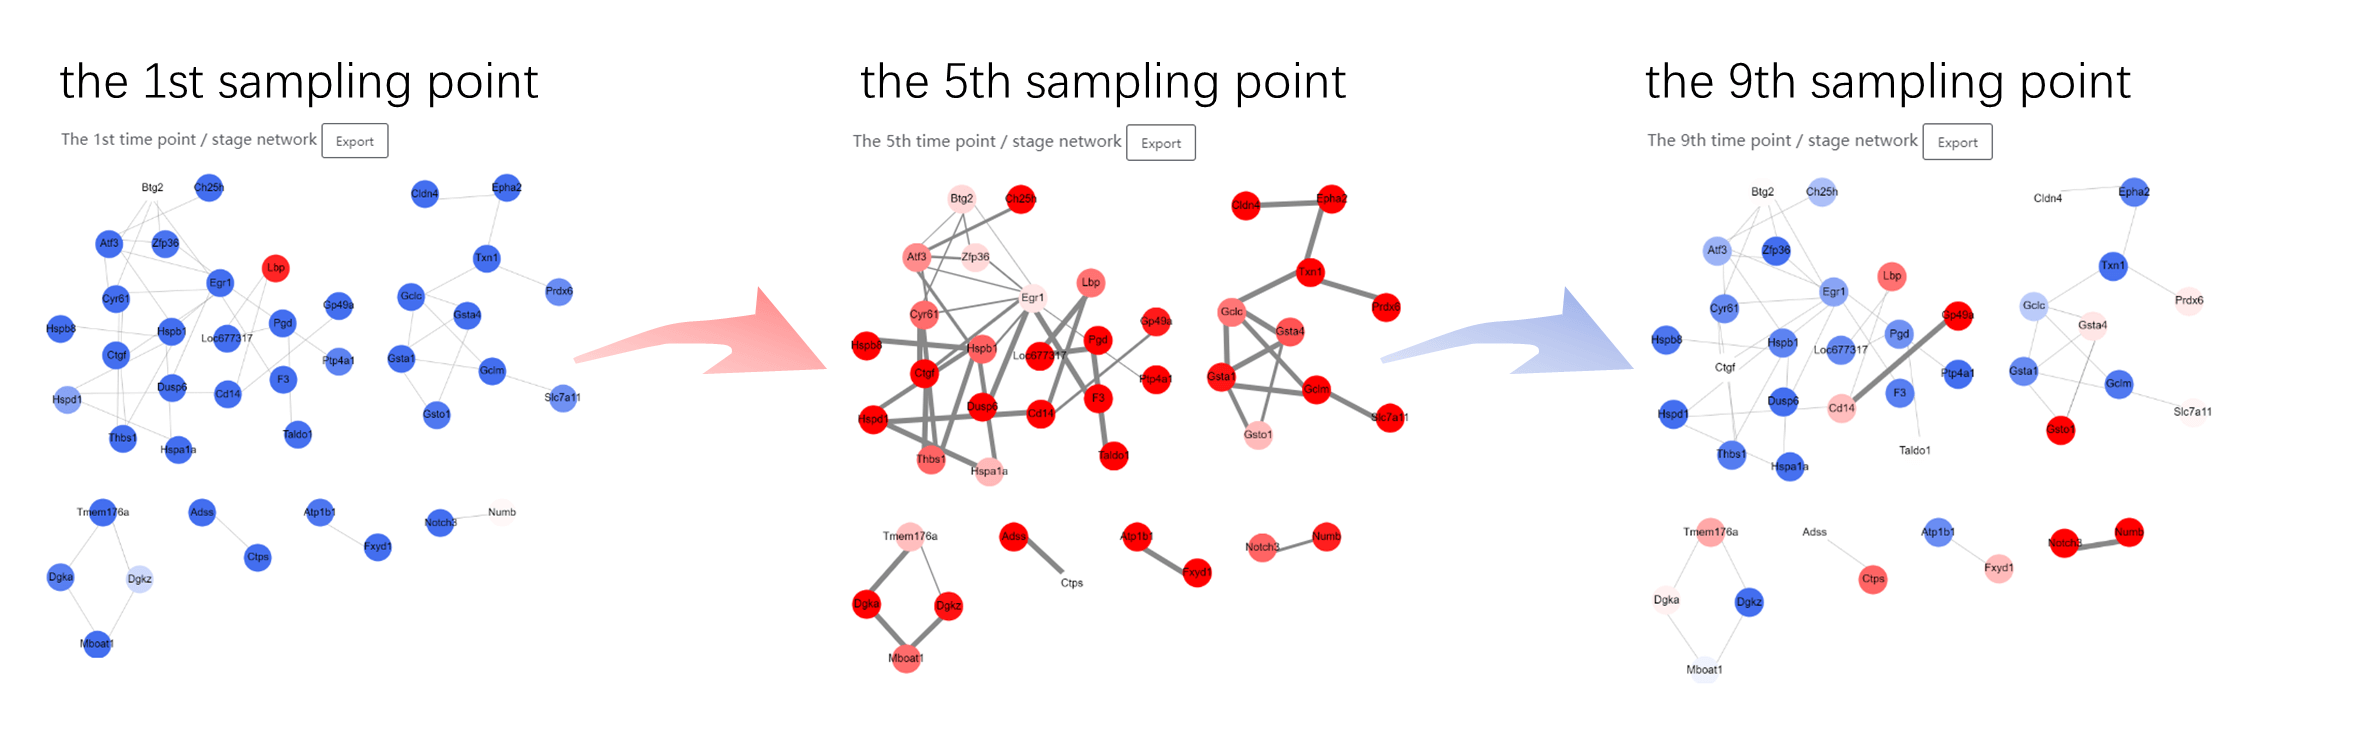
The dataset GSE2565 from NCBI GEO database is obtained from a mouse experiment of phosgene-induced acute lung injury. Lung tissue was collected from air and air-phosgene-exposed mice at 0.5, 1, 4, 8, 12, 24, 48, and 72 hours post-exposure. During the experiment for both case and control groups, there are totally nine sampling points, i.e., 0, 0.5, 1, 4, 8, 12, 24, 48, and 72 hours, while at each sampling time point, lung tissues were obtained from six mice.

Ⅱ. Input Data format

TPD can read two types of files: .xlsl/.xls or .csv.

Example Data format: The case and control groups can be respectively processed as a microarray. They have the same size. There are totally 54 columns in each microarray and each 6 columns represents a time/stage points from 6 mouse. The row represents gene expression level of samples. In our algorithm, the control groups is viewed as reference samples.

Please refer to the above format for user-defined data.

Ⅲ. Parameter Setting

Bold font indicates the parameter settings of this example.

Data upload: If the reference group is selected, please upload two files, including case data and control data. If the no reference group is selected, please upload a case file.The analysis system takes the first time point/stage as control data.

Survival Analysis: Choice on demand.

Species selection: Different Species selections correspond to different PPI networks.This example belongs to Mus musculus.

Method selection: Single-sample Landscape Entropy(SLE).

Cutoff threshold: This threshold determines the number of genes in network map, high entropy gene table and low entropy gene table.3% by default.

Data selection: Group data by column. There are totally 54 columns in this example and each 6 columns represents a time/stage points from 6 mouse.

Ⅳ. Output

There was the most significant sudden upward trend in the 4th-8th hour, so the 8th hour (the 5th sampling point) was determined as the critical point of acute lung injury in mice. This is consistent with the original experimental observation that 50% - 60% of the mice died at the 12th hour (the 6th sampling point).

Line chart with Tipping Point:The x-axis represents different stages, and the y-axis represents the average SLE score of the current stage.

Landscape based on SLE Score:The dynamical change of local SLE scores demonstrates the landscape of the network entropy in a global view. The x-axis represents different stages,and the y-axis represents different genes, and the z-axis represents the average SLE score of the current stage.

Dynamic network:The color of each node corresponds to its entropy (blue for low entropy, red for high entropy); the thickness of each edge corresponds to its correlation.

Top High/low Entropy Gene:High entropy and low entropy genes are tabulated and downloadable.